

| Geospatial Data Analyst
Portfolio
Maps


Dashboards
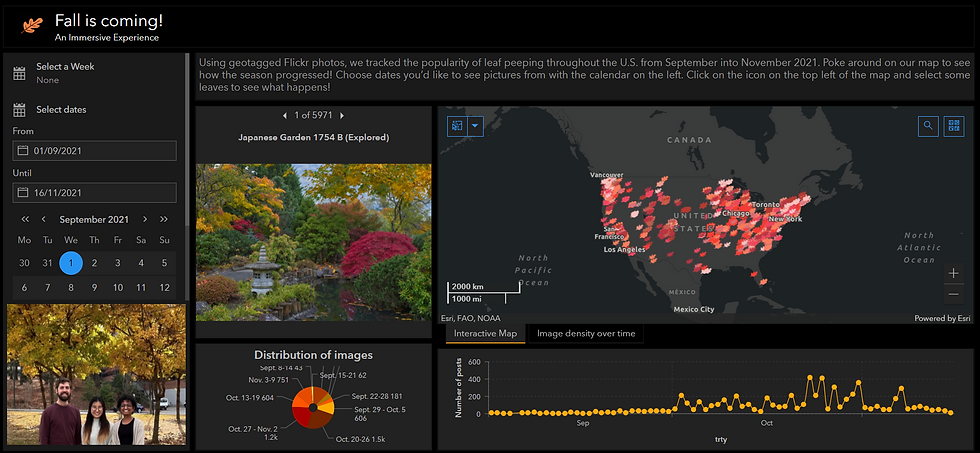
Our objective was to make an interactive map showing: • When leaves were in peak color throughout the U.S. during Fall 2021 • Where good places are for people to go and take pictures of the leaves

Research Question: Does transit accessibility, represented in the form of the derived metric ‘Transit Score’, improve with increasing values of the following urban form indices; street intersection density, building footprint ratio and transit stop density while controlling for socioeconomic and demographic factors?


Project Posters
The major goal of this project was to find the hotspots or very critical zones of forest fires at different levels with the help of a few independent variables like elevation and landuse to find the overall risk to endangered animal species for each county in the state of California.

This project involved researching the geomorphological changes that happened to the Brahmaputra river including the sediment accretion and erosion for the purpose of ferry night navigation.

In this study we created the following models: ARIMA, MLP, LSTM, CNN, LSTM-CNN. They were trained/tested by ANN in order to predict the future value of SST for the period of observation (2003 to 2020) over the regions of Arabian Sea and the Bay of Bengal. Then the SST data were analyzed for seasonal and annual variations.

In this study, Sentinel-1 SLC SAR Imagery was analysed in relation to predict the plant parameters like height, percentage canopy cover, and biomass in the Mysuru District. For this analysis, classical machine learning algorithms were used to create a model. This allowed determining the extent to which the other factors apart from the backscatter (VH, VV) affected the plant parameters, such as the Radar Vegetation Index (RVI), Intensity Ratio (VH/VV), Anisotropy, Alpha, Entropy and Coherence.